04. Life-support and utility systems
Summary
This chapter sizes every system needed to keep 150 people alive, comfortable and connected on a 2 ha floating town, and asks whether "fully solar" survives contact with engineering arithmetic. The answers are mostly yes, with several corrections to the design basis (Section 14).
- Energy demand is about 1.7 MWh a day, not 1 MWh. A bottom-up load model for Phase 1 gives 1,670 kWh/day (range 1,250 to 2,260), or about 610 MWh a year. Air-conditioning in 25 large houses is the biggest single load. Desalination is only about 10%. The after-diversity peak is about 200 kW in the evening and 260 kW at midday. Phase 2 (400 people) is about 4.4 MWh/day.
- Solar plus batteries can carry essentially all of it. An hourly simulation over 19 years of PVGIS weather data for the Gulf of Panama recommends 800 kWp of PV and 2.5 MWh of LFP batteries. Solar then supplies about 99.5 to 99.8% of annual electricity in the central case (the lower figure counts generator test runs) and about 97.5% in the high-load case. The PV fits on the roofs, with canopies as headroom. A system with no generator at all needs about 1,000 kWp and 4 MWh, about US$1m more, and still protects against nothing except weather.
- A combustion backup is still required, for safety rather than energy. The recommended architecture is solar plus LFP as the main source, plus two 150 kW generators running on hydrotreated vegetable oil (HVO) as an independent emergency source. Including monthly test runs, they would supply about 0.5% of annual energy in a normal year and up to 3% in a bad one. Every comparable island microgrid examined (Tokelau, Ta'u) kept a generator.
- Water is easy, food is not. Seawater reverse osmosis (SWRO) at 32 to 38 m³/day uses about 170 kWh/day. Seven to eight days of storage and N+1 trains make water robust. The 2,000 m² of food production can supply most fresh vegetables by mass, but only about 6% of calories (range 3 to 8%). The town will import about 95% of its food on a weekly supply run.
- Systems CAPEX is about US$12m (low 6.5m, high 21m) before integration and contingency, and OPEX is about US$2.2m a year. Staffing dominates OPEX. Transport and safety systems dominate CAPEX, not energy.
Verdict: Amber. Every system is buildable with off-the-shelf 2026 technology. The caveats are battery fire safety on a floating structure, single-point failures with long repair times at sea, and load growth eroding the solar margin.
Headline sizing
| Item | Phase 1 (150 people) | Phase 2 (400 people) |
|---|---|---|
| Daily electricity demand | 1,670 kWh/day (1,250 to 2,260) | 4,360 kWh/day (3,270 to 5,890) |
| Peak demand (after diversity) | ~200 kW evening, ~260 kW midday | ~520 kW evening, ~680 kW midday |
| Solar PV | 800 kWp (700 to 1,000) | 2,100 kWp (1,800 to 2,600) |
| LFP battery (usable) | 2.5 MWh (2 to 4) | 7.5 MWh (6.5 to 10) |
| Backup | 2 × 150 kW HVO gensets, 10 m³ fuel | 3 × 200 kW HVO gensets |
| Generator share of annual energy | ~0.5% (0.2 to 3%; ~9% worst stress case) | similar |
| Potable water | 32 m³/day average, 38 m³/day design | ~85 m³/day average, 100 m³/day design |
| SWRO installed | 3 × 25 m³/day (N+1) | 4 × 35 m³/day |
| Potable storage | 250 m³ (7 to 8 days) | 700 m³ |
| Food self-sufficiency | ~6% of calories; most fresh vegetables | similar or lower |
1. Basis and reference sites
This chapter follows the design basis: Phase 1 utilities sized for 150 people (about 100 residents, 10 to 15 crew and up to 20 visitors), with modular growth to 400. Two reference sites bracket the "tropical, outside the cyclone belts" brief:
- Gulf of Panama, 8.9°N 79.5°W. This represents archetype 1, sheltered host-state water close to a port and an international airport. It is the main reference, consistent with the cost chapter.
- Tarawa, Kiribati, 1.35°N 173°E. This represents an equatorial Pacific site, a proxy for archetypes 2 and 3.
All solar figures come from the EU Joint Research Centre's PVGIS 5.3 tool. PVGIS returns its ERA5 reanalysis data at both sites; its SARAH-3 satellite database does not cover the Gulf of Panama.1 ERA5 is a weather model rather than a satellite measurement, so the results are cross-checked against the Solargis-based Global Solar Atlas and NASA POWER (Section 3). The simulation below uses PVGIS hourly output for 2005 to 2023 (19 years, 166,000 hours) at each site.2
Costs are in 2026 US dollars. Euro figures are converted at €1 = US$1.13, the 4 November 2026 rate used in the cost chapter. Where no published benchmark exists, the figure is labelled an estimate.
2. Energy demand model
2.1 Assumptions
- Houses. 25 houses of 250 m² floor area on 150 m² footprints. About 150 m² per house is air-conditioned with high-efficiency inverter split or multi-split units (seasonal COP around 4). The envelope is well shaded and insulated. Cooking is induction. Hot water comes from heat pumps. Lighting is LED.
- Benchmark. In Singapore, a hot and humid city at 1.3°N, average household consumption in 2024 was 522 kWh/month for private condominiums and 1,208 kWh/month for landed houses (about 17 and 40 kWh/day).3 Our 250 m² houses sit between the two at 26 kWh/day (790 kWh/month). That assumes an efficient envelope and some discipline over thermostat settings.
- Flexible loads. Desalination, greenhouse fans, the workshop and boat charging are scheduled into daylight hours where possible. Desalination runs about 16 hours a day, mostly in daylight, so the plant does not have to be oversized threefold.
- Ferry charging. The fast ferry charges mainly at the shore terminal. The platform supplies resident leisure boats and ferry top-ups only (Section 10).
2.2 Phase 1 load table
| Load | kWh/day (central) | Basis |
|---|---|---|
| Houses: air-conditioning | 350 | 25 × 14 kWh. About 3 kW of cooling on average per house at COP 4. Profile weighted to afternoon and night |
| Houses: cooking, hot water, laundry, dishwashing | 188 | 25 × 7.5 kWh |
| Houses: refrigeration, lighting, IT, fans | 112 | 25 × 4.5 kWh |
| Houses subtotal | 650 | 26 kWh per house per day |
| Communal buildings | 330 | School 60; clinic (24 h, medical refrigeration, oxygen) 40; town hall, café and store with commercial kitchen and retail refrigeration 120; 16 guest and staff rooms at 7 kWh each, 110 |
| Desalination (SWRO) | 170 | 38 m³/day design × 4.5 kWh/m³ (Section 6) |
| Water distribution and pressure pumps | 12 | About 0.3 kWh/m³ |
| Wastewater (membrane bioreactor) and sludge | 45 | About 30 m³/day × 1.1 kWh/m³, plus dewatering (Section 7) |
| Cold store (chilled and frozen reserve) | 60 | 40 m³ chilled plus 40 m³ frozen, tropical ambient (estimate) |
| Greenhouse and hydroponics | 50 | Ventilation fans and nutrient pumps only, no artificial lighting (Section 8) |
| Workshop | 25 | Daytime tools, compressor, welding |
| Marina electric-boat charging (platform share) | 150 | 10 resident boats at about 10 kWh/day, plus ferry top-ups |
| Street and public lighting | 25 | About 60 LED fittings at 40 W for 11 hours |
| Comms, IT, control systems (SCADA), CCTV | 48 | 2 kW continuous: satellite terminals, network, servers, VHF |
| Safety systems on standby | 36 | Detection, jockey pumps, navigation lights, bilge and ballast monitoring |
| Pool and public realm | 20 | Filtration pump and chlorinator |
| Power plant auxiliaries | 50 | Battery-room air-conditioning, inverter standby losses |
| Total, central | 1,671 | ≈ 610 MWh a year; 11 kWh per person per day |
| Total, low case (×0.75) | 1,253 | Smaller conditioned area, strict setpoints |
| Total, high case (×1.35) | 2,256 | Singapore landed-house behaviour, more charging |
About 36% of daily energy is used between 18:00 and 07:00 and must come from the battery.
2.3 Peak demand
The hourly average load peaks at about 120 kW. The design peak is higher because short loads coincide: induction hobs, kettles, pumps and chargers. The figures below use after-diversity maximum demand. These are engineering estimates.
| Load group | Evening peak, 19:00 to 21:00 (kW) | Midday peak (kW) |
|---|---|---|
| Houses (25 × about 4.5 kW in the evening, about 3 kW at midday) | 112 | 75 |
| Communal buildings | 35 | 70 |
| Desalination (2 trains) | 10 | 10 |
| Water, wastewater and cold store | 12 | 14 |
| Greenhouse and workshop | 0 | 30 |
| Boat charging | 10 | 50 |
| Lighting, comms, safety, pool, auxiliaries | 14 | 12 |
| Total | ≈ 195 to 200 | ≈ 260 |
The battery inverters (power conversion system, or PCS) should be grid-forming and rated at about 2 × 250 kVA (N+1 at the evening peak), with surge capacity for fire-pump and compressor starts. PV inverters total about 650 kWac. Phase 2 scales roughly 2.6×: about 520 kW in the evening, 680 kW at midday, and 1.2 MVA of battery inverters.
2.4 Phase 2
The same method for 75 houses, scaled communal buildings and 100 m³/day of water gives 4,360 kWh/day (3,270 to 5,890), or about 1.6 GWh a year. The components are houses 1,950, communal 760, desalination 450, boats 350 and everything else 850.
Comparison with the design basis. The brief's indicative 1 MWh/day is about 40% below this central estimate and below even the low case. The gap comes mainly from air-conditioning 6,250 m² of housing and 1,500 m² of communal buildings in the tropics. The design basis should adopt 1.7 MWh/day as the Phase 1 planning figure.
3. Solar supply
3.1 Resource
| Metric | Gulf of Panama (8.9°N) | Tarawa (1.35°N) |
|---|---|---|
| Global horizontal irradiation, Global Solar Atlas (Solargis)4 | 1,839 kWh/m²/yr | 2,146 kWh/m²/yr |
| Global horizontal irradiation, NASA POWER climatology5 | 1,806 kWh/m²/yr | 2,146 kWh/m²/yr |
| In-plane irradiation, PVGIS-ERA5 (10° and 5° tilt)67 | 1,873 kWh/m²/yr | 2,176 kWh/m²/yr |
| Specific yield, PVGIS (14% system losses) | 1,420 kWh/kWp/yr (3.89/day) | 1,665 kWh/kWp/yr (4.56/day) |
| Specific yield, Global Solar Atlas | 1,483 kWh/kWp/yr | 1,703 kWh/kWp/yr |
| Worst and best month, PVGIS | 3.25 (Jul) and 4.77 (Feb) kWh/kWp/day | 4.07 (Jun) and 4.97 (Oct) kWh/kWp/day |
| Year-to-year standard deviation of annual yield | 1.6% | 5.2% |
The three datasets agree within about 5%. That gives reasonable confidence in the annual totals, though not in the depth of short cloudy spells, which reanalysis tends to smooth (Section 4.2). Tarawa has about 17% more sun than Panama, but its rainfall and cloud swing more with El Niño.
3.2 Performance ratio
PVGIS's default 14% loss, together with its temperature and angle-of-incidence losses, gives an implied performance ratio of 0.76 at both sites. For a marine town, three further losses are applied (engineering assumptions):
- Soiling and salt: −3%. Salt films stick to modules, and dew helps them adhere. A Barbados study found that only modules within 20 m of the sea showed a substantial gain after cleaning.8 A 2026 coastal study measured yield losses of no more than 1.6% with 7-day cleaning, no more than 3.5% with 14-day cleaning, and 5 to 7.5% with 30-day cleaning, in an arid climate.9 Tropical rain helps, so fortnightly rinsing with rainwater should hold the loss to about 3%.
- Shading and mixed orientation: −4%. Modules sit on many small, low-tilt roofs among trees and two-storey buildings.
- Ageing to year 20: −8%. This assumes about 0.4% a year for good glass-glass modules.
The design performance ratio at year 20 is therefore about 0.65. The design yield is 3.33 kWh/kWp/day in Panama and 3.88 in Tarawa.
3.3 Required capacity and whether it fits
On an average day, the Phase 1 load (1,670 kWh plus about 60 kWh of battery losses) needs about 520 kWp. Covering July in Panama needs about 620 kWp. Covering multi-day cloudy spells without a generator is what drives capacity higher (Section 4). The recommended size is 800 kWp (700 to 1,000).
Module power density is taken as 185 Wp per m² of usable roof. That is conservative for 2026 modules of about 22% efficiency laid at low tilt.
| Surface | Gross area (m²) | Usable fraction | Usable area (m²) | Capacity (kWp) |
|---|---|---|---|---|
| House roofs | 3,750 | 70% | 2,625 | 485 |
| Communal roofs | 1,500 | 70% | 1,050 | 195 |
| Utilities roofs | 800 | 80% | 640 | 120 |
| Roofs subtotal | 4,315 | ≈ 800 | ||
| Canopies: paths (1,000 m²), plaza shade (1,000 m²), marina (500 m²) | 2,500 | 90% | 2,250 | 415 |
| Total available | 6,565 | ≈ 1,215 |
800 kWp fits, but only just, and only if almost every roof is given to PV. Canopies offer about 50% headroom, at extra structural cost. The greenhouse cannot carry opaque PV. Roof design for PV (low-pitch, unshaded, with no rooftop plant) is therefore a design-code requirement, not an option. If the high-load case materialises, the town needs about 1,000 kWp, which uses most of the canopies.
Phase 2 needs about 2,100 kWp, or about 11,000 m² of PV surface. That works only if the platform grows roughly in proportion to the population (about 2.5 to 3 times). If Phase 2 densifies on the same 2 ha, PV cannot keep up, and floating PV or load reduction becomes necessary.
3.4 Marine-grade considerations
- Modules. Specify glass-glass modules certified to IEC 61701 salt-mist severity 6, the most severe level. That test runs eight 7-day cycles of salt spray and humid storage (56 days) with electrical and insulation checks before and after.101112 IEC 61701 links exposure to the ISO 9223 atmospheric-corrosivity classes. The platform edge should be treated as the worst class.
- Mounting. Use anodised aluminium or 316 stainless steel, with isolation between dissimilar metals to prevent galvanic corrosion. Fix modules mechanically rather than with ballast, because the deck moves. Keep tilt low (5 to 10°) to limit wind uplift. Keep a no-PV zone at the windward edge for spray and edge speed-ups. Wind loads should follow EN 1991-1-4 or ASCE 7 with platform-specific speed-up factors from the structural chapter.
- Electrical. Put inverters in ventilated, conditioned rooms rather than on roofs. Use DC surge protection on every string (Section 11). Use marine-rated cable glands and inspect them yearly for salt tracking.
- Floating PV on adjacent water. This is not needed for Phase 1. It may be needed for Phase 2. Conventional floating PV is mature only in sheltered water. Offshore floating PV in waves is still at pilot stage. Oceans of Energy's North Sea pilot has operated 12 km offshore for four years, and 2025 wave-flume tests with DNV present found no module damage from 2.5 m breaking waves, but certification is still being developed.1314 In a lagoon, shading of seagrass or coral would also need an environmental assessment.
4. Storage
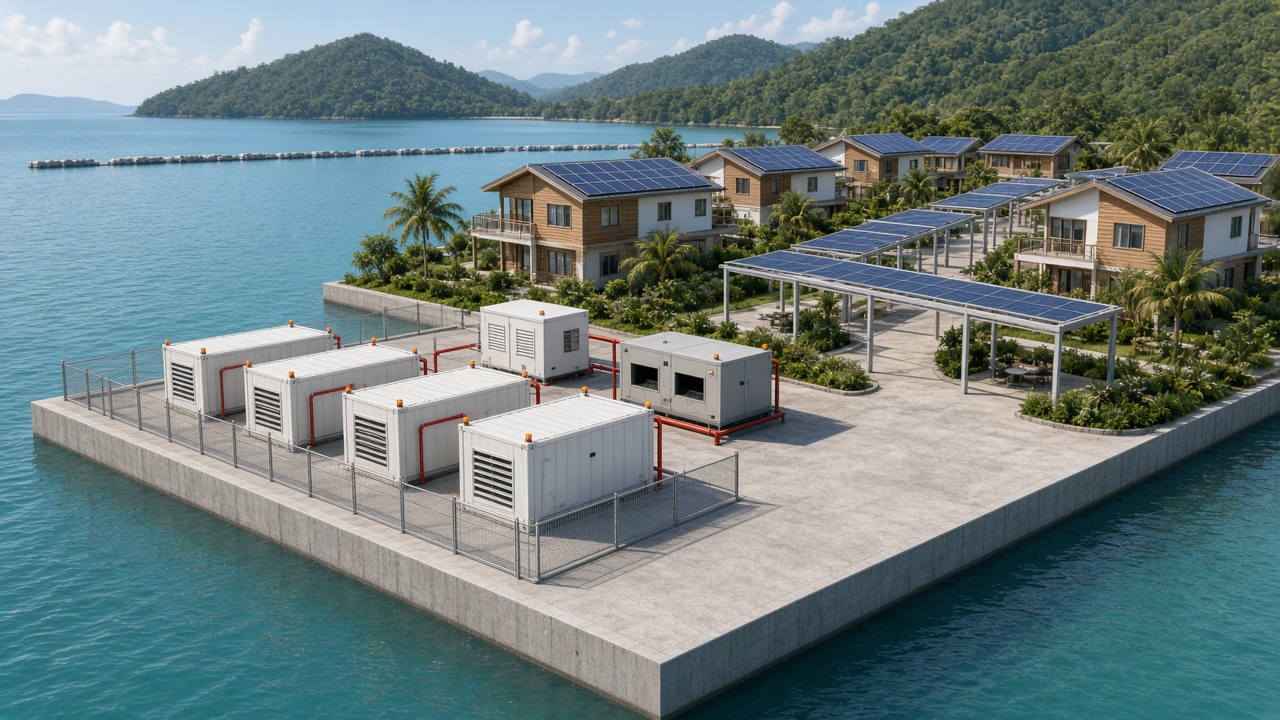 AI-generated impression, not a design drawing. Energy systems: LFP battery enclosures and a backup-generator housing on a fenced corner of the deck, solar on every roof, and PV canopies over paths. The study recommends wider fire separation between battery enclosures than shown here.
4.1 Method
The hourly model runs the Phase 1 load profile against 19 years of PVGIS hourly output. The PV output is derated as in Section 3.2. Assumptions:
- Battery charge and discharge efficiencies are 95% each (90% round trip, including the inverter).
- 15% of battery capacity is ring-fenced as a life-safety reserve.
- The generator covers any deficit once the battery reaches that reserve.
Configurations were compared on annualised cost: 7% discount rate, 25-year PV life, 13-year battery life, and fuel at about US$0.65/kWh delivered (an estimate).
4.2 Irradiance variability
Daily PV yield relative to the long-term mean, from the PVGIS hourly series:
| Worst run of consecutive days | Panama | Tarawa |
|---|---|---|
| 1 day | 13% | 6% |
| 3 days | 31% | 28% |
| 5 days | 39% | 39% |
| 7 days | 47% | 50% |
| 14 days | 62% | 60% |
| 30 days | 73% | 69% |
There are no multi-day blackouts of sun. The design case is a week at roughly half output. Reanalysis smooths cloud, so real dark spells may be somewhat deeper. The stress tests below allow for that.
4.3 Results
| Phase 1 configuration (Panama) | Generator share of annual energy | Worst year | Generator hours a year | PV curtailed |
|---|---|---|---|---|
| 600 kWp, 1.0 MWh (least annualised cost) | 4.2% | 5.6% | 670 | 16% |
| 750 kWp, 2.0 MWh | 0.35% | 1.1% | 52 | 30% |
| 800 kWp, 2.5 MWh (recommended) | 0.15% | 0.7% | 22 | 35% |
| 900 kWp, 3.0 MWh | 0.05% | 0.3% | 7 | 42% |
| 1,000 kWp, 4.0 MWh (no generator use in 19 years) | 0% | 0% | 0 | 48% |
The same 800 kWp and 2.5 MWh configuration at Tarawa needs the generator for 0.09% of energy. Stress tests on the recommended configuration (Panama):
| Case | Generator share | Worst year |
|---|---|---|
| Solar yield 15% lower than modelled | 0.41% | 1.3% |
| Solar yield 25% lower | 1.7% | 2.6% |
| High load (2,260 kWh/day) | 2.5% | 3.6% |
| High load and 15% lower yield | 8.5% | 10.6% |
| Low load (1,250 kWh/day) | 0% | 0% |
The least-cost point runs a generator for 670 hours a year. That works on paper, but it relies on the generator, which defeats the brief. The recommended 800 kWp and 2.5 MWh costs about US$80k a year more in annualised terms (roughly 50% more on this narrow energy-only comparison). In return it:
- cuts generator running to about one day a year in the central case;
- keeps the generator share under 4% even with high load;
- removes most fuel logistics, noise and engine maintenance.
In practical terms, 2.5 MWh usable means:
- about 2.0 MWh of delivered energy above the reserve, or about three average nights if the days are covered by PV;
- about 1.2 days of full load with no sun at all;
- about 2.4 days of essential loads alone (about 35 kW);
- a ring-fenced 375 kWh reserve, which is about 11 hours of life-safety load.
The 35% curtailment is not waste. On an average day it means roughly 900 kWh of free midday energy for ferry charging, running desalination flat out, making ice and pre-cooling the cold store.
Phase 2 (Panama) with 2,100 kWp and 7.5 MWh gives a 0.11% generator share, or 2.2% in the high-load case.
4.4 Chemistry, cost and lifetime
Lithium iron phosphate (LFP) is the only sensible choice. It now accounts for more than 80% of utility-scale storage. Nickel manganese cobalt (NMC) cells go into thermal runaway at a lower temperature and release more energy when they do.15
Price. BNEF's 2025 survey put stationary-storage pack prices at US$70/kWh and global average turnkey system prices at US$117/kWh: US$73 in China, US$177 in Europe and US$219 in the United States.1617 Pacific island tenders in 2018 priced batteries at US$200 to 750/kWh.18 Marine installation adds:
- fire-rated enclosures;
- gas detection and suppression;
- class review;
- small-lot freight.
This chapter uses US$250 / 400 / 650 per kWh installed (low, central, high). That is an estimate.
Lifetime. Typical LFP datasheets quote more than 6,000 cycles at 80% depth of discharge (25 °C, end of life at 80% capacity).19 The town's battery cycles only about 100 equivalent full cycles a year, so calendar ageing, which heat accelerates, sets its life. Plan replacement at year 12 to 15, with the battery room air-conditioned to about 25 °C. At today's prices, replacement costs US$0.6m to 1.0m. A sinking fund of US$40k to 70k a year covers it.
4.5 Fire safety of a large battery on a floating structure
This is the single most serious hazard introduced by "fully solar". The rules and incident record point to clear design principles.
What the rules say.
- DNV makes its Battery(Safety) class notation mandatory for lithium-ion installations above 20 kWh on DNV-classed vessels. It requires protection against thermal-runaway propagation, ventilation and fire suppression.20
- The Danish Maritime Authority, drawing on hybrid ferries with 2.4 to 3 MWh of batteries, requires:21
- a separate battery space treated as a category A machinery space, with A-60 insulation against other fire risks;
- independent ventilation that exhausts to a safe place in open air;
- a fixed automatic fire-extinguishing system;
- consideration of gas detection;
- class approval of the batteries;
- a risk analysis under MSC.1/Circ.1455.
- Classification guidance from CR, the Taiwanese classification society, adds:22
- module design that prevents runaway spreading from cell to cell, or at least from module to module;
- no essential-service equipment inside battery spaces;
- avoiding seawater as an extinguishing agent, because it conducts electricity.
- DNV's updated rules require watertight boundaries below the waterline, at least IP44 enclosures and stricter rules on liquid-cooled systems.23
What the incidents show.
- Ytterøyningen (Norway, 2019). A twisted gasket let battery coolant leak, causing arcing at 1,000 V DC and a glycol-fuelled fire. The cell-level runaway isolation worked. Then the seawater sprinkler, installed as an extra barrier, caused short circuits, and battery gases exploded about 12 hours after the fire had been put out.2425 A firefighter later showed symptoms of hydrogen fluoride exposure.26
- Moss Landing (California, January 2025). A 300 MW / 1.2 GWh NMC battery packed indoors in a former turbine hall caught fire. The sprinklers proved ineffective and were shut off. Flames broke through the roof, about 1,200 people were evacuated, and the building and batteries were a total loss.27
- The wider record. EPRI's incident database shows the failure rate per GW deployed falling 97% between 2018 and 2023. Balance-of-system and controls, not cells, were the leading identified causes. 72% of incidents occurred during construction, commissioning or the first two years of operation.28
Design response (recommended):
- Use LFP only, in modules type-tested against cell-to-module propagation.
- Split the 2.5 MWh into four or five separate enclosures of no more than about 650 kWh. Separate them by A-60 boundaries or open distance. Never use one battery hall.
- Put the batteries at the downwind utility edge, above the waterline, away from houses, the school and muster stations. Vent explosions upwards over the sea.
- Fit off-gas detection (H₂, CO, volatile organics) that isolates and ventilates the enclosure automatically. Use a clean-agent or water-based fixed system supplied with fresh water. Provide boundary cooling for neighbouring enclosures. Never discharge seawater into a battery space.
- Strongly consider a separate battery pontoon moored a few tens of metres off the main platform on flexible cables. It can be disconnected and towed clear in a runaway event, turning a town-threatening fire into an equipment loss. This is an engineering judgement and needs class discussion.
- Commission rigorously with independent third-party witnessing, because most failures happen early. Adopt DNV Battery(Safety) or equivalent voluntarily, even if no flag state requires it.
4.6 Flywheels and hydrogen
- Flywheels suit high-power, short-duration, high-cycle duties. Sandia notes there is no commercially viable long-duration flywheel for energy shifting.29 On a moving deck they would also add gyroscopic loads. The grid-forming battery inverters already provide the power quality a flywheel would add. Rejected.
- Hydrogen (electrolyser, tanks, fuel cell) has a round-trip efficiency of about 40%, against 70 to 90% for lithium-ion.30 It is attractive only for very large or seasonal stores. Here the residual energy gap is about 1 to 20 MWh a year, and a compressed-hydrogen store on a crowded floating town adds an explosion hazard. A fuel cell running on delivered hydrogen or methanol could replace the HVO generators later if regulation or ideology demands it. It is not justified now.
5. The honest question: is 100% solar viable for life-safety?
For energy, nearly. For life-safety, no, not on its own.
The simulation shows a solar-only town would almost never run short of energy, given 1,000 kWp and 4 MWh. But life-safety failures at sea rarely come from weather. They come from equipment:
- an inverter or controller fault;
- a cable fire;
- a battery enclosure that has to be isolated;
- a lightning strike on the switchboard;
- a fault that coincides with a cloudy week and a part that takes five weeks to arrive.
Ship rules address exactly this. SOLAS requires passenger ships to carry a self-contained emergency source of power. It must be located so that a fire or casualty in the main power spaces cannot disable it. It must supply emergency lighting, navigation lights, radio, fire detection, and fire and bilge pumps for 36 hours. A transitional battery must bridge the first 30 minutes, and an emergency generator must start automatically.31
SOLAS allows a battery as the emergency source. So an independent second battery of about 1.3 MWh (35 kW × 36 h) could technically keep the town "100% solar". But it gives only 36 hours of endurance for life-safety loads. A generator with 10 m³ of stored HVO gives about a month of essential load, for less money and less fire load.
Precedents. Tokelau, the first nation to go "100% solar" in 2012, built about 1 MW of PV and batteries, with generators running on coconut oil as backup. Solar supplies at least 90%, and the generators cover cloudy periods.3233 Ta'u in American Samoa installed 1.4 MW of PV and 6 MWh of Tesla batteries, marketed as able to run the island for three days without sun.34 The utility nevertheless installed three 275 kW Cummins diesel generators as backup.35 Local reporting later suggested solar was meeting about 80% of demand while faults were fixed.36
Recommended architecture:
| Layer | Equipment | Role |
|---|---|---|
| Primary generation | 800 kWp PV on roofs and canopies | Supplies more than 99% of annual energy |
| Primary storage and grid | 2.5 MWh LFP in 4 to 5 enclosures; 2 × 250 kVA grid-forming inverters; microgrid controller | Overnight supply and cloudy spells; holds 15% life-safety reserve |
| Emergency and backup source | 2 × 150 kW HVO generator sets, N+1, in a separate fire zone from the batteries, with their own switchboard; 10 m³ HVO tank | Automatic start on loss of main supply; also recharges the battery in long cloudy spells or after battery failure |
| Transitional source | Small UPS batteries for emergency lighting, GMDSS radio and the fire-alarm panel (30 min or more) | SOLAS-style bridging |
| Load shedding | Automatic tiers: (1) boat charging, pool, workshop; (2) air-conditioning setpoints raised, desalination throttled; (3) essential only | Keeps generator running rare |
Why HVO. Hydrotreated vegetable oil is a paraffinic drop-in diesel to EN 15940. It resists oxidation and microbial growth and can be stored for up to about ten years. FAME biodiesel, by contrast, should be stored for no more than 6 to 12 months.37 Caterpillar describes HVO as suitable for standby generators and FAME biodiesel as not.38 HVO's flash point is above that of mineral diesel,39 which comfortably meets the SOLAS minimum of 43 °C for emergency-generator fuel.31
Share of annual energy. In normal years the generators supply energy for about 22 hours a year (0.9 MWh). Monthly one-hour load tests add about 1.8 MWh. In total that is about 2.7 MWh, or 0.45% of annual energy, using about 800 litres of HVO (at an assumed 3.3 kWh per litre). In a bad year with high load it rises to about 3%, and in the worst stress case to about 9 to 10%.
It is honest to describe the town as "solar-powered, with a renewable-fuel safety net". It is not honest to call it "100% solar".
5.1 Wave energy and OTEC
- Wave energy. It is still pre-commercial and the field has not converged on one design. The JRC gives an average levelised cost of about €270/MWh for the most mature devices (technology readiness levels 7 to 9).40 A 2024 market model uses about €170/MWh as current cost.41 The EU target is €100/MWh by 2035.42 There is also a contradiction: archetype 1 is chosen precisely for small waves. Wave machines on the platform would also add mooring and fatigue loads. Rejected for Phase 1. A small demonstration device could be hosted later as a research tenant.
- OTEC (ocean thermal energy conversion). OTEC needs about a 20 °C difference between surface water and deep water at about 800 to 1,000 m. PNNL's 1 MW reference case for Kumejima draws about 232,000 m³/day of deep water, loses about 40% of its gross output to parasitic loads, and costs about US$22m. That is about US$22,000 per kW.43 Makai believes commercial viability starts at about 10 MW.44 The town's average load is about 70 kW. OTEC is two orders of magnitude out of scale. Rejected. Deep-water cooling for air-conditioning is worth a look only if a Phase 3 site has deep water within a few kilometres.
6. Water
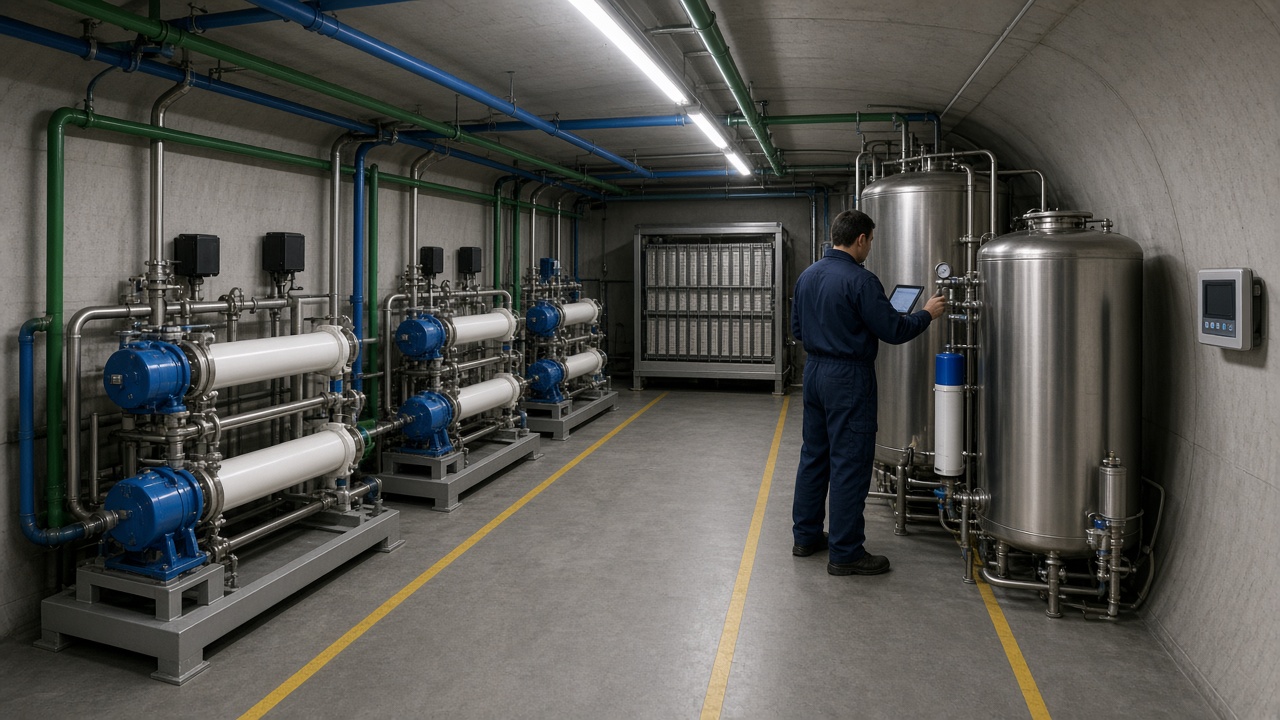 AI-generated impression, not a design drawing. The plant room inside the hull: three small reverse-osmosis trains (one spare), potable storage, UV treatment and a membrane bioreactor for wastewater, sized for about 38 m³ of water a day.
6.1 Demand
The WHO classes "optimal access", meaning multiple taps and continuous supply, as more than 100 L per person per day. Its "basic access" level of about 20 L/day covers drinking, cooking and handwashing only.45 Singapore households used 142 L per person per day in 2024, against a 2030 target of 130 L.46 This chapter designs for 130 L per person per day of domestic use, with water-efficient fittings.
| Use | m³/day |
|---|---|
| Domestic, 150 people × 130 L | 19.5 |
| Communal (school, clinic, café, guest laundry) | 2.3 |
| Hydroponics (about 20 L/kg47 × 36 t/yr) | 2.0 |
| Garden and park top-up, beyond rain and reused effluent | 3.0 |
| Pool make-up (evaporation from about 300 m²) | 1.8 |
| Workshop, boat wash, fire-system testing, PV rinsing | 1.0 |
| Losses and flushing (+8%) | 2.4 |
| Average potable production | ≈ 32 |
| Design (peak month, ×1.2) | ≈ 38 |
6.2 SWRO plant
Energy. Published specific energy for SWRO ranges from 3 to 6.7 kWh/m³. Plants with pressure-exchanger energy recovery achieve 3.0 to 5.3 kWh/m³, and two-pass designs 4.0 to 4.8 kWh/m³.48 Modelling of a whole plant, including pre-treatment and sludge handling, gives 3.9 to 5.6 kWh/m³.49 Small containerised plants sit at the upper end. This chapter uses 4.5 kWh/m³, or about 170 kWh/day, which is about 10% of the town's load.
Configuration. Three trains of 25 m³/day each give 75 m³/day installed and 50 m³/day firm with one train out (N+1), above the 38 m³/day design demand. Each train is containerised and has:
- a pressure-exchanger energy recovery device;
- ultrafiltration pre-treatment, which tolerates algal blooms and oily water better than media filters;
- a cartridge-filter stage.
At 40 to 45% recovery the plant draws about 80 m³/day of seawater and returns about 45 to 50 m³/day of brine. The intake should be a screened subsurface intake about 10 m below the hull, upstream of the marina and the wastewater outfall.
Water quality. Desalinated water is low in minerals, poorly buffered and corrosive. WHO recommends remineralising it, for example through limestone contactors or by dosing calcium and magnesium salts, and controlling it under a water safety plan.50 The recommended post-treatment is:
- calcite contactor;
- UV;
- chlorination, with a residual of 0.2 to 0.5 mg/L in distribution;
- online monitoring of conductivity, turbidity, free chlorine and pH;
- weekly microbiological sampling.
Cost. Supplier quotations in 2026 for containerised SWRO equipment ran at US$800 to 1,100 per m³/day for 100 to 150 m³/day plants, excluding intake, tanks, civil works and installation.51 A supplier guide gives US$1,800 to 2,500 per m³/day for small plants (100 to 1,000 m³/day).52 This chapter uses US$2,000 / 3,500 / 5,000 per m³/day installed on 75 m³/day, plus storage.
6.3 Storage
Potable storage of 250 m³ is split between at least two separately valved compartments. That gives:
- 7 to 8 days at normal demand;
- about 80 days at WHO "basic" rationing (20 L per person per day);
- enough time to replace a membrane set or rebuild a high-pressure pump from on-board spares.
Integral hull tanks are cheapest, but 250 t of water must be included in the stability and trim calculations in the structural chapter. Firefighting uses seawater from the fire main, so it does not draw on potable storage.
6.4 Rainwater harvesting
| Panama | Tarawa | |
|---|---|---|
| Mean annual rainfall | 1,917 mm (Panama District)53 | 2,052 mm (1951 to 1990)54 |
| Seasonality | Dry season January to mid-April. NASA POWER shows 0.3 to 0.6 mm/day in January to March5 | Wet season November to April. In La Niña droughts, as little as 150 mm in a year, and 95 mm between August 1998 and February 199955 |
Catchment is 5,000 m² of house and communal roofs. With a runoff coefficient of 0.8 and 75% capture efficiency, the town collects about 5,700 m³ a year in Panama (15.6 m³/day). That is nearly half of average demand, but almost nothing for three months each year. Bridging the dry season would need about 3,000 m³ of storage, which is not realistic on a floating deck.
Rainwater is therefore a supplement, not a source. A 100 m³ non-potable tank feeds toilets, laundry, irrigation and PV rinsing. It can cut desalination output by a third in the wet season. Desalination must be sized for 100% of demand.
6.5 Brine discharge
Global desalination produces about 142 million m³/day of brine.56 The town's 50 m³/day is tiny by comparison, but it would go into exactly the kind of sheltered, reef-fringed water archetype 1 prefers. A California science panel found that well-designed discharges with rapid initial dilution in well-flushed water affect only a few tens of metres. Poorly diluted discharges in poorly flushed water have altered seagrass, coral and soft-sediment communities. The panel recommended keeping the salinity increase at the edge of the mixing zone to no more than 5%, and preferred multiport diffusers or co-disposal with treated wastewater.57 Dense brine can also creep along the seabed beyond the mixing zone.58
Recommendation:
- blend brine with treated effluent before discharge;
- discharge through a short diffuser on the downstream side of the platform, in the best-flushed water;
- use phosphonate-free antiscalants;
- run a before-and-after, control-and-impact (BACI) monitoring programme as a host-state permit condition.
7. Wastewater and solid waste
7.1 Standards
MARPOL Annex IV type-approval standards (resolution MEPC.227(64)) require effluent from sewage treatment plants to meet:59
| Parameter | Limit |
|---|---|
| Thermotolerant coliforms | ≤ 100 per 100 mL |
| Total suspended solids | ≤ 35 mg/L |
| BOD₅ (5-day biochemical oxygen demand) | ≤ 25 mg/L |
| COD (chemical oxygen demand) | ≤ 125 mg/L |
| pH | 6 to 8.5 |
Passenger ships discharging in Annex IV special areas must also remove nutrients:
| Nutrient | Limit |
|---|---|
| Total nitrogen | ≤ 20 mg/L, or 70% removal |
| Total phosphorus | ≤ 1.0 mg/L, or 80% removal |
Next to a reef, the special-area nutrient standard should be the design minimum. The host state may demand more. The legal chapter records that Panama refused Satoshi permission to discharge treated wastewater locally, so a negotiated outfall permit is a precondition, not a detail.
7.2 Plant
- Flow. About 85% of potable use, or 27 to 30 m³/day.
- Plant. Two 20 m³/day membrane bioreactor (MBR) trains (N+1 at average flow). Upstream: screening and one day of equalisation. Downstream: UV. MBR effluent is very low in solids and pathogens, which allows reuse. A packaged 50 m³/day MBR uses about 1.0 to 1.2 kWh/m³.60
- Reuse. UV-treated permeate supplies toilet flushing and ornamental irrigation (5 to 10 m³/day). That reduces both desalination demand and discharge.
- Sludge. An estimated 5 to 10 kg of dry solids a day is dewatered by screw press to about 20% solids, giving 25 to 50 kg/day of cake. It is co-composted with food and garden waste in an in-vessel composter. The output goes on ornamental beds only, or ashore. It should not go on food crops.
- Cost. Supply-and-install costs for a 50 m³/day MBR plant exceed about US$1,800 per m³/day.61 Chinese municipal MBRs average about US$600 per m³/day at much larger scale.62 This chapter uses US$150k / 300k / 500k for MBR, reuse, sludge and composting together.
7.3 Solid waste
The world generated 2.56 billion tonnes of municipal waste in 2022, about 0.9 kg per person per day.63 Designing for 1.0 kg gives about 150 kg/day, or 55 t a year.
- Minimise. Buy in bulk, use returnable crates, and run a deposit scheme for drinks containers.
- Organics. An estimated 40 to 50% goes to the in-vessel composter.
- Recyclables. Aluminium, PET and cardboard are baled. Glass is crushed. They return to shore on the supply boat.
- Residual and hazardous waste. An estimated 20 to 30 t a year of residual waste, plus batteries, oils and clinical waste, goes to licensed shore contractors.
- Incineration. Not recommended. It would emit smoke and toxic air pollutants next to homes, create ash to handle and add an operating burden, all to save perhaps one supply-boat backhaul a week (judgement).
8. Food
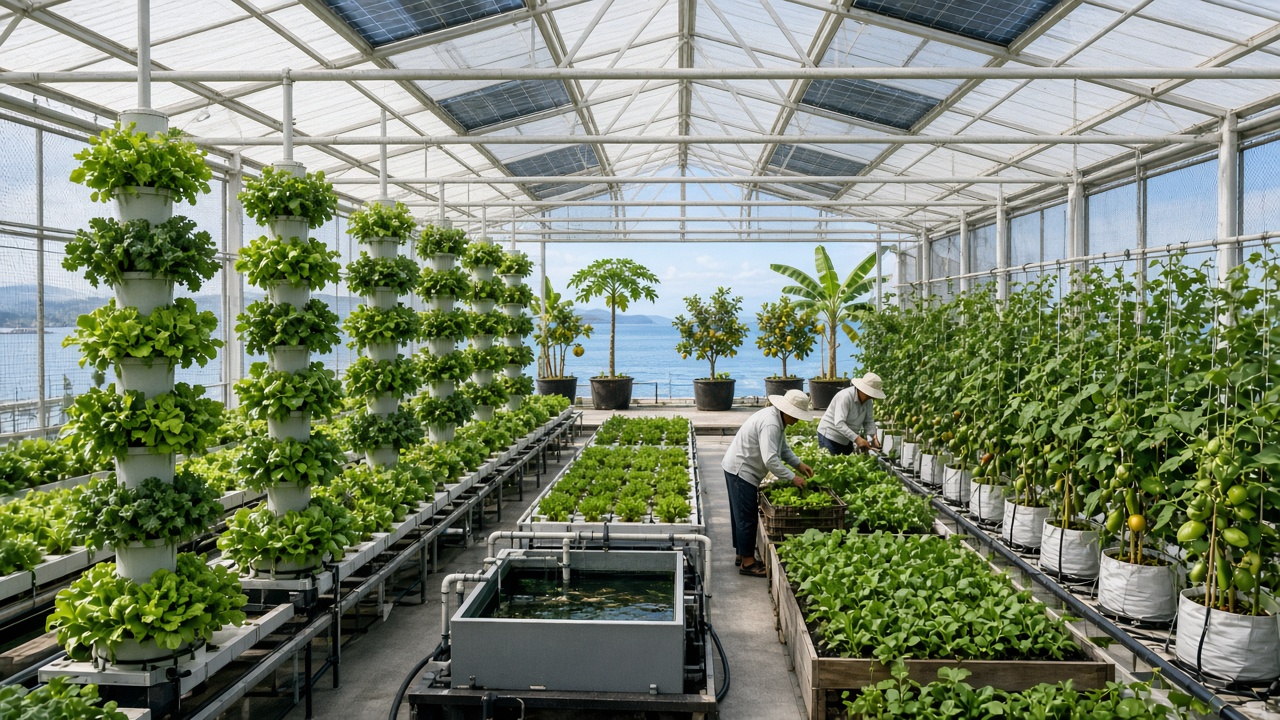 AI-generated impression, not a design drawing. The greenhouse: hydroponic towers, trellised crops and a small aquaponics tank, with a container orchard beyond. Even 2,000 m² of growing area supplies only about 6% of calories, though most fresh vegetables.
8.1 Calorie arithmetic
The requirement is 150 people × 2,200 kcal a day (a mixed adult and child population) × 365 days, or about 120 million kcal a year. The figure is anchored to the FAO/WHO/UNU energy-requirement framework.64 The 2,000 m² of food production is assumed to be laid out as follows:
| Element | Growing area | Yield assumption | Output | kcal a year |
|---|---|---|---|---|
| Hydroponic leafy greens (nutrient film technique) | 600 m² net | 25 kg/m²/yr, against 41 kg/m²/yr modelled with artificial light and climate control47 | 15 t | 2.3 million (at an assumed 15 kcal/100 g, similar to tomato) |
| Hydroponic tomatoes, cucumbers and peppers | 700 m² net | 30 kg/m²/yr. A tropical hydroponic trial gave 28.8 to 30.0;65 a Paraguayan commercial greenhouse targets 3566 | 21 t | 3.8 million (tomato 18 kcal/100 g67) |
| Orchard and staple beds, plus 30% of private gardens | 500 + 750 m² | About 1,000 kcal/m²/yr. Taro, sweet potato and yam yield about 3 to 10 million kcal per hectare per season68 | 1.25 million | |
| Total | 36 t | 7.3 million, or about 6% of need |
Low and high yields give a range of 3 to 8%.
The striking result is the contrast. Calories: about 6%. Fresh vegetables: plenty. The WHO recommends at least 400 g of fruit and vegetables a day for everyone over ten.69 For 150 people that is about 22 t a year, so 36 t of greens and salad vegetables could meet most of the community's vegetable needs by mass. Fruit variety, grains, oils, dairy and protein must be imported.
Energy constraint. Barbosa's hydroponic lettuce needed about 90,000 kJ (25 kWh) per kg in Arizona, with artificial light and cooling.47 At that intensity, 15 t of lettuce would need about 1,000 kWh/day, which is 60% of the whole town's load. The greenhouse must therefore be naturally lit, shade-netted and fan-ventilated. Its 50 kWh/day budget is a hard design limit.
8.2 Aquaculture
- Seaweed. Tropical Eucheuma farms yield about 15 to 30 dry tonnes per hectare per year.70 Seaweed is a cash crop for carrageenan, not a staple. FAO lists the environmental risks of poorly managed farms: disease, genetic contamination from non-native species, and damage to the seabed from anchors.71 Introduced Kappaphycus has escaped farms and overgrown corals in Hawaii.72
- Fish in cages. These would need imported feed, add nutrient load beside a reef and need a host-state aquaculture licence.
- Shellfish. These need no feed, but risk contamination from the town's own outfall.
Recommendation: no commercial aquaculture in Phase 1. At most, a permitted trial of a native seaweed or sea grape species, sited away from the outfall.
8.3 Supply chain and reserves
The town will import about 95% of its calories. That is roughly 1.5 to 2.5 t of food and consumables a week (an estimate):
- Weekly. A contracted supply run by landing craft or supply vessel, which takes recyclables back to shore.
- Daily. Light fresh items travel on the passenger ferry.
- Reserves. 30 days of ambient dry stores in archetype 1, rising to 90 days in archetypes 2 and 3. Ninety days of dry staples for 150 people is about 30 million kcal, about 8.5 t at roughly 3,500 kcal/kg, or about 25 m³ of shelving (an estimate). Add about 30 days of frozen food (about 1.5 t), held in 40 m³ chilled and 40 m³ frozen stores.
9. Connectivity
Primary: Starlink Maritime. The current Global Priority plans run from 50 GB at US$250 a month to 2 TB at US$2,150 a month. The Flat High Performance terminal costs US$1,499.73 It draws 110 to 150 W, is rated IP56 and is specified to survive winds above 280 km/h.74 Beyond the 12 nm territorial sea, Ocean Mode data on the cheaper plans has cost US$6/GB since 27 September 2026.75 ISPreview reports a "Personal Maritime" plan at US$185 a month with unlimited data in territorial waters.76 It should be confirmed with Starlink before relying on it.
A town of 25 households, a school and a clinic might use 6 to 10 TB a month (judgement). On Global Priority that costs US$75k to 125k a year. In archetype 1, a point-to-point microwave link to shore, or the cheaper territorial-water plans, could cut that to US$15k to 30k. Install three terminals at separate points, so that no single mast, fire or lightning strike takes the town offline.
Second provider.
- Eutelsat OneWeb is in service at sea. Maritime airtime starts at about €600 a month for 100 GB, with a committed rate.77 Its Intellian dual-antenna terminals list at about US$27,000.78
- Amazon Leo (formerly Project Kuiper) signed its first maritime resellers in February 2026. Its Pro and Ultra antennas are quoted at up to 400 Mbps and 1 Gbps.79 More resellers followed in October 2026.80 Availability over the actual site should be confirmed before relying on it. It should be treated as the likely second LEO provider from 2027.
- Geostationary VSAT is not needed for broadband if there are two LEO constellations plus a shore link.
Marine safety radio (GMDSS). The GMDSS defines four sea areas. A1 is within VHF coast-station range with DSC alerting, A2 within MF range, and A3 within coverage of a recognised mobile-satellite service. Since 2024, A3 depends on the ship's own satellite terminal: global with Iridium, roughly 70°S to 70°N with Inmarsat.8182 The platform should carry:
- fixed and handheld VHF-DSC radios;
- an MF/HF-DSC set if outside A1;
- an Iridium GMDSS or Inmarsat-C terminal;
- 406 MHz satellite emergency beacons (EPIRBs);
- AIS search-and-rescue transmitters;
- NAVTEX;
- an AIS base station that marks the structure.
All of these sit on the 36-hour emergency supply (Section 5). VHF-band EPIRBs are no longer acceptable.82
10. Transport
Ferry. Candela's P-12 Shuttle is a useful benchmark:
- 30 seated passengers;
- 336 kWh usable battery;
- 25 knot service speed;
- 40 nm range;
- DC charging at up to 300 kW (10 to 85% in about 45 minutes at 175 kW);
- foiling in waves up to about 1 m significant height, and on its hull up to 2 m.8384
Reported list prices for the Shuttle at launch range from €1.7m to €2.5m (about US$1.9m to 2.8m).8586
That works out at about 8.4 kWh per nautical mile. Three round trips a day on a 10 nm route would use about 500 kWh, 30% of the whole town's daily load. The ferry should therefore charge mainly at the shore terminal and soak up the platform's midday surplus (Section 4.3).
Distance limits.
- With charging at both ends, an electric fast ferry is practical up to about 15 to 18 nm one way with reserve.
- Archetype 2 (12 to 200 nm) is beyond electric range and needs HVO-fuelled hybrid vessels.
- In archetype 3, transport cannot be fuel-free. The "fully solar" claim then covers the town, not its lifeline.
Supply and workboats. Weekly supply runs use a contracted landing craft or supply vessel. Heavy lifts, such as battery modules, membrane racks and gensets, need a platform crane of about 5 t at a set radius, or crane barges (an estimate). The platform should own a workboat and a dedicated fast rescue boat, ready around the clock.
Medical evacuation.
| Option | Speed and time | Notes |
|---|---|---|
| Fast boat (archetype 1, 10 nm) | About 25 knots, so about 25 minutes plus embarkation | Primary option in archetype 1; limited by sea state |
| Helicopter | The AW139 cruises at up to 165 knots, so 100 nm takes about 36 minutes plus dispatch time87 | Needs a helideck. For an AW139 the UK CAP 437 standard gives a 17 m "D-value" and 7.0 t mass.88 The deck plus its obstacle-free sector takes perhaps 600 to 1,000 m² of public space (an estimate). It is not in the design-basis land-use table |
| Seaplane | Not relied upon: limited by sea state and landing permissions (judgement) |
Recommendation. In archetype 1, a boat is the primary medevac route, with a helicopter winching area as backup. In archetypes 2 and 3, a certified helideck is mandatory. The governance chapter's guidance on evacuation times applies.
11. Safety systems
- Fire detection and suppression.
- Every building has addressable detection linked to a central fire panel and the control system.
- Homes and communal buildings have automatic sprinkler or water-mist protection. IMO resolution A.800(19) is the model for accommodation sprinklers.89 UK guidance notes that approved water-mist systems extinguish fires with less than 5 L/m²/min.90 US Coast Guard guidance uses a 280 m² design area for accommodation on international voyages.91
- Fresh water from a pressure tank feeds the first minutes, with automatic changeover to the seawater fire main.
- The fire main is a ring main with hydrants. It has two fire pumps, one on the emergency switchboard, plus a monitor at the marina and foam at the fuel store and helideck.
- Firefighting on a floating structure. Firewater stays on the deck, so scuppers and drainage must be sized for firefighting flow. The structural chapter must check that the platform stays stable with water on deck. Timber-rich houses also need separation distances (architecture chapter). A trained resident fire team is essential, because no shore fire service can arrive in time.
- Flooding and bilges.
- Every hull compartment has two independent level sensors and a fixed bilge suction, plus portable salvage pumps.
- Draught sensors at the corners, and ballast and trim monitoring, feed the control system.
- Alarms reach the duty engineer's phone and the control room.
- Structural health monitoring (engineering judgement on the instrument set):
- strain gauges at module connectors;
- accelerometers and motion sensors;
- inclinometers;
- mooring-line load cells;
- cathodic-protection and corrosion probes;
- a wave buoy and weather station. Data logged against design limits gives early warning and the inspection record that underwriters will ask for.
- Lightning. Coastal Central America is one of the world's lightning hotspots. The central equatorial Pacific sees far less lightning.9293 Design an IEC 62305 protection system:
- air terminals on tall buildings and masts;
- PV frames bonded to a common earth with seawater-earthed hull plates;
- surge protection at every PV string, inverter and satellite terminal (the Starlink power supply has a dedicated earth terminal74).
- Muster and life-saving appliances. Two muster stations at opposite ends of the platform, and a public-address and general alarm system. Liferafts for 125% of the maximum on board, distributed around the perimeter, and lifejackets for 125%. Evacuation by ferry and rescue boat, with drills each quarter. SOLAS chapter III and the Life-Saving Appliances Code are the right reference even if the platform is not classed as a ship.
- Clinic. The governance chapter concludes, from cruise-industry ACEP guidelines, that the town needs three to four clinicians on rotation. It also needs an emergency stabilisation room, an intensive-care bed and an isolation room. Equipment to match:
- defibrillator, plus public AEDs around the platform;
- transport ventilator and patient monitors;
- point-of-care laboratory tests, ultrasound and portable digital X-ray;
- oxygen concentrator and cylinders;
- 30 to 90 days of pharmacy stock;
- a telemedicine link over Starlink;
- stretchers compatible with boats and helicopters.
12. Maintenance and staffing
12.1 Staffing
| Role | Full-time staff (Phase 1) |
|---|---|
| Utilities manager or chief engineer | 1 |
| Electrical and power technicians (PV, batteries, inverters, gensets; on call around the clock) | 2 |
| Water and wastewater operators (SWRO, MBR, laboratory) | 2 |
| Marine and hull technicians (compartments, coatings, cathodic protection, moorings; divers contracted) | 2 |
| Air-conditioning, refrigeration and building maintenance | 2 |
| IT, communications and GMDSS radio operator | 1 |
| Boat crew (ferry master and deckhands, two shifts) | 3 |
| Clinicians (governance chapter) | 3 to 4 |
| Safety officer and fire-team lead | 1 |
| Stores, logistics and food production | 2 |
| Total | 19 to 20 (16 if residents cover some roles) |
This is above the design basis's 10 to 15 resident staff. Running utilities professionally at sea needs about 16 to 20 people, depending on how many roles qualified residents can cover. Fully loaded staff cost is about US$0.8m to 2.4m a year (estimate).
12.2 Spares and failure arithmetic
At sea, the time to repair a fault is set by logistics, not by the hours of skilled labour. An illustrative calculation, with assumed figures:
| Case | Mean time between failures | Mean time to repair | Availability |
|---|---|---|---|
| Single pump, part shipped from Europe | 20,000 h | 30 days (720 h) | 96.5%, or 13 days a year without the function |
| Same pump with a spare on the shelf | 20,000 h | 24 h | 99.9% |
| N+1 pair, no spare | About 99.9% |
The same logic sets the spares strategy:
- N+1 redundancy on every life-critical function: inverters, SWRO trains, MBR trains, fire pumps, gensets and satellite terminals.
- An on-board spares holding of about 3 to 5% of systems CAPEX, kept by criticality ranking. It should include:
- inverter power modules;
- two spare battery modules per enclosure type;
- a complete set of RO membranes;
- high-pressure pump and pressure-exchanger kits;
- MBR blowers and membranes;
- genset overhaul kits;
- control-system cards and a spare satellite terminal.
- Standardisation. One inverter family, one pump family and one PLC platform, to keep the spares list short.
- Remote monitoring by vendors over Starlink, and annual service visits written into supply contracts.
13. Systems summary: CAPEX and OPEX (Phase 1, 2026 US$ thousands)
CAPEX covers supply, marine-grade installation and commissioning. It excludes design, classification, integration (add 12 / 18 / 25%) and contingency, which the cost chapter applies. Energy figures in OPEX exclude self-generated electricity, which is a sunk cost. "Estimate" means no direct published benchmark was found.
| # | System and sizing | CAPEX low | CAPEX central | CAPEX high | OPEX low/yr | OPEX central/yr | OPEX high/yr | Unit basis |
|---|---|---|---|---|---|---|---|---|
| 1 | Solar PV, 800 kWp on roofs, inverters included | 960 | 1,440 | 2,240 | 24 | 40 | 64 | US$1.2 / 1.8 / 2.8 per Wp. Benchmarks: IRENA global utility-scale US$691/kW (2024);94 US commercial rooftop US$1.98/W (2025);95 US PV US$1,865/kWac (2024);96 Pacific islands about US$3/W (2018).18 O&M US$30 to 80 per kWp a year, against the US$40 commercial benchmark,95 plus cleaning |
| 2 | LFP battery, 2.5 MWh usable, in 4 to 5 fire-separated enclosures with detection and suppression | 625 | 1,000 | 1,625 | 25 | 55 | 100 | US$250 / 400 / 650 per kWh installed, against BNEF turnkey US$117 to 219/kWh17 and Pacific tenders US$200 to 750/kWh.18 OPEX includes a replacement fund for year 12 to 15 |
| 3 | Battery inverters (2 × 250 kVA grid-forming), microgrid controller, main and emergency switchboards, LV distribution | 400 | 700 | 1,200 | 10 | 20 | 35 | Estimate |
| 4 | Backup generation: 2 × 150 kW HVO gensets, emergency switchboard, 10 m³ tank, enclosure | 180 | 240 | 450 | 10 | 15 | 35 | US$600 / 800 / 1,500 per kW. NREL used US$800/kW for diesel backup with US$35 per kW a year O&M;97 public-sector purchases of 20 to 249 kW sets show a median of US$760/kW.98 Fuel: 0.8 to 7 m³ of HVO a year at an assumed US$2 to 3/L |
| 5 | SWRO, 3 × 25 m³/day; post-treatment; 250 m³ potable storage | 250 | 460 | 750 | 8 | 15 | 30 | US$2,000 / 3,500 / 5,000 per m³/day5152 plus storage at US$400 to 1,500/m³ (estimate). OPEX covers membranes, chemicals and cartridges at about US$0.7 to 2.5/m³ (estimate) |
| 6 | Rainwater harvesting: gutters, first flush, 100 m³ non-potable tank, UV | 40 | 80 | 150 | 2 | 3 | 5 | Estimate |
| 7 | Wastewater: 2 × 20 m³/day MBR, equalisation, UV reuse, sludge press, in-vessel composter | 150 | 300 | 500 | 10 | 20 | 40 | More than US$1,800 per m³/day for 50 m³/day MBR61 plus sludge and reuse equipment (estimate) |
| 8 | Solid waste: sorting station, baler, glass crusher, storage | 60 | 120 | 250 | 15 | 30 | 60 | Estimate. OPEX is shore disposal and tipping fees |
| 9 | Greenhouse, 2,000 m² marine-grade, naturally ventilated, with hydroponics | 300 | 500 | 800 | 15 | 25 | 40 | US$150 / 250 / 400 per m², against South-East Asian high-tech greenhouses at US$80 to 250/m² (supplier guide)99 plus a marine wind-load premium |
| 10 | Cold store (40 m³ chilled and 40 m³ frozen) and dry stores for 90 days | 80 | 150 | 300 | 3 | 5 | 10 | Estimate |
| 11 | Connectivity: 3 Starlink terminals, OneWeb dual antenna, shore microwave link (archetype 1), platform network, GMDSS and AIS | 150 | 300 | 500 | 15 | 75 | 125 | Starlink US$1,499 per terminal and US$250 to 2,150 a month;73 OneWeb about US$27k hardware78 and €600+ a month.77 GMDSS kit is an estimate |
| 12 | Transport: electric fast ferry (30 passengers), fast rescue boat, workboat, 2 × 175 kW DC chargers | 1,700 | 3,200 | 5,000 | 60 | 110 | 200 | P-12 Shuttle €1.7m to 2.5m;8586 rest estimate. OPEX covers maintenance and insurance (crew sits in row 17) |
| 13 | Medevac: certified helideck (D17, 7 t) with lighting and foam; none in the low case | 0 | 800 | 1,500 | 20 | 70 | 170 | Estimate. OPEX includes a medevac retainer |
| 14 | Fire detection and suppression, fire main, flood and bilge monitoring, structural monitoring, lightning protection, life-saving appliances | 1,200 | 2,200 | 4,000 | 40 | 80 | 150 | Estimate (whole-platform). OPEX covers servicing and inspections |
| 15 | Clinic equipment | 250 | 500 | 900 | 40 | 70 | 120 | Estimate. OPEX covers consumables and pharmacy |
| 16 | Initial spares holding and workshop tools | 200 | 400 | 700 | About 3 to 5% of systems CAPEX | |||
| 17 | Staffing, 16 to 20 full-time staff (systems, marine, medical) | 780 | 1,440 | 2,420 | 12 / 16 / 22 staff × US$65k / 90k / 110k fully loaded (estimate) | |||
| 18 | Contracted logistics: weekly supply run | 80 | 150 | 260 | Estimate, depends on distance | |||
| Total | 6,545 | 12,390 | 20,865 | 1,157 | 2,223 | 3,864 | ||
| Total with integration and engineering (+12 / 18 / 25%) | 7,330 | 14,620 | 26,080 | |||||
| Energy subtotal (rows 1 to 4) | 2,165 | 3,380 | 5,515 | 69 | 130 | 234 |
Notes for the cost chapter:
- That chapter's energy line assumes 300 to 500 kWp with 3 to 5 MWh. This chapter's modelling shows that combination is short of PV and long on battery. Replace it with 800 kWp (700 to 1,000) and 2.5 MWh (2 to 4). The energy subtotal of about US$2.2m to 5.5m is close to that chapter's US$1.5m to 5.3m, so its conclusion that energy is a small share of CAPEX stands.
- Rows 11 to 15 overlap with that chapter's lines K (other utilities) and L (vessels). Use one or the other, not both.
- Staffing here (16 to 20) is above that chapter's 10 to 15. The difference is mainly clinicians and boat crew.
Phase 2 increments (sizing only). PV to 2,100 kWp, battery to 7.5 MWh, battery inverters to 1.2 MVA, gensets to 3 × 200 kW, SWRO to 4 × 35 m³/day, MBR to 3 × 40 m³/day, potable storage to 700 m³, a second ferry, and about 30 staff. As a first approximation, scale rows 1 to 10 by about 2.3 and rows 11 to 18 by about 1.5 (estimate).
14. Assumptions in the design basis that should change
- Energy demand. Change "~1 MWh/day" to ~1.7 MWh/day (range 1.25 to 2.25) for Phase 1 and ~4.4 MWh/day for Phase 2.
- "Fully solar". Restate as "solar supplies at least 97% of electricity in any year, with an independent renewable-fuel (HVO) emergency source for life-safety". Note also that transport beyond about 15 nm cannot be electric.
- Staff. Raise from 10 to 15 to 16 to 20 for Phase 1.
- Land use. Add a helideck allowance (600 to 1,000 m², taken from public space) for archetypes 2 and 3. Reserve all roofs for PV through the design code. The utilities area of 800 m² just fits batteries, SWRO, MBR, gensets, stores and switchrooms if batteries are on deck. Moving the batteries to a separate pontoon (Section 4.5) would free space and is recommended.
- Phase 2 density. 400 people on the same 2 ha cannot be solar-powered from roofs. Phase 2 needs the platform to grow roughly in proportion to population, or adjacent floating PV.
- Food. Set the expectation at about 5% of calories and most fresh vegetables, not "self-sufficiency".
Verdict: AMBER (feasible with significant caveats)
All life-support systems can be built from proven 2026 equipment at a combined cost of about US$12m (US$6.5m to 21m) before integration and contingency, and about US$2.2m a year to run. Solar plus LFP batteries can supply over 99% of electricity in a normal year from roofs alone. Water is robust with N+1 desalination and a week of storage. "100% solar" is not responsible for life-safety. An independent HVO generator supplying under 1% of annual energy is the recommended safety net. Food will be about 95% imported.
Top risks 1. Battery fire on a floating structure. Low probability, catastrophic consequence. Mitigate with LFP only, small fire-separated enclosures or a detachable battery pontoon, fresh-water rather than seawater suppression, gas detection, and rigorous third-party commissioning. 2. Load growth eroding the solar margin. With high load and 15% lower solar yield, the generator share rises to about 9%, and roof area caps PV at about 1.2 MWp. Mitigate with building-envelope standards, sub-metering and tiered tariffs for air-conditioning, and reserved canopy space. 3. Single-point failures with long repair times. A failed inverter, controller or high-pressure pump can take weeks to replace by sea. Mitigate with N+1 throughout, a 3 to 5% spares holding, standardised equipment and vendor remote monitoring. 4. Discharge permits and marine environment. The host state may refuse brine or effluent discharge, as Panama did with Satoshi. Mitigate by designing to the MARPOL special-area nutrient standard, reusing effluent, blending and diffusing brine, and BACI monitoring. 5. Distance-driven fragility in archetypes 2 and 3. Electric ferries, fast-boat medevac and cheap connectivity all fail beyond about 15 to 20 nm. Mitigate by choosing archetype 1, or by budgeting for a helideck, hybrid vessels, Global Priority satellite plans and 90-day food reserves.
References
-
European Commission Joint Research Centre, "PVGIS 5.3 API non-interactive service" (radiation databases and parameters). https://joint-research-centre.ec.europa.eu/photovoltaic-geographical-information-system-pvgis/using-pvgis-5/api-non-interactive-service_en (accessed 4 Nov 2026). ↩
-
JRC PVGIS 5.3, hourly series (seriescalc), PVGIS-ERA5, 2005 to 2023, 1 kWp, 14% loss, 10° tilt, Gulf of Panama. https://re.jrc.ec.europa.eu/api/v5_3/seriescalc?lat=8.9&lon=-79.5&peakpower=1&loss=14&angle=10&aspect=0&pvcalculation=1&raddatabase=PVGIS-ERA5&startyear=2005&endyear=2023&outputformat=json (Tarawa: lat=1.35&lon=172.98) (accessed 4 Nov 2026). Analysis by this author. ↩
-
Ministry of Sustainability and the Environment, Singapore, "Written reply to parliamentary question on monthly average electricity and water consumption rates for households" (2024 data). https://www.mse.gov.sg/latest-news/written-reply-to-parliamentary-question-on--monthly-average-electricity-and-water-consumption-rates-for-households/ (accessed 4 Nov 2026). ↩
-
World Bank / Solargis, Global Solar Atlas, long-term averages API for 8.9,−79.5 and 1.35,172.98 (data version 1.7, to 2025). https://api.globalsolaratlas.info/data/lta?loc=8.9,-79.5 ; viewer at https://globalsolaratlas.info/ (accessed 4 Nov 2026). ↩
-
NASA Langley, POWER Project climatology API, ALLSKY_SFC_SW_DWN and PRECTOTCORR, Gulf of Panama point. https://power.larc.nasa.gov/api/temporal/climatology/point?parameters=ALLSKY_SFC_SW_DWN,PRECTOTCORR&community=RE&longitude=-79.5&latitude=8.9&format=JSON (accessed 4 Nov 2026). ↩↩
-
JRC PVGIS 5.3 PVcalc, Gulf of Panama, 1 kWp, 14% loss, 10° tilt. https://re.jrc.ec.europa.eu/api/v5_3/PVcalc?lat=8.9&lon=-79.5&peakpower=1&loss=14&angle=10&aspect=0&outputformat=json (accessed 4 Nov 2026). ↩
-
JRC PVGIS 5.3 PVcalc, Tarawa, 1 kWp, 14% loss, 5° tilt. https://re.jrc.ec.europa.eu/api/v5_3/PVcalc?lat=1.35&lon=172.98&peakpower=1&loss=14&angle=5&aspect=0&outputformat=json (accessed 4 Nov 2026). ↩
-
Dust accumulation and PV power output in the tropical environment of Barbados, SET 2015 proceedings, paper 471. https://caravelpress.com/proceedings/set/papers/2015.025/set.2015.025.pdf (accessed 4 Nov 2026). ↩
-
"Impact of coastal extreme weather stressors on bifacial floating-based and ground solar PV systems", Thermal Science and Engineering Progress (ScienceDirect, 2026). https://www.sciencedirect.com/science/article/pii/S2451904926004440 (accessed 4 Nov 2026). ↩
-
TÜV Rheinland PTL, "Salt corrosion testing per IEC 61701:2011, severity (6)" (2014). https://www.irishellas.com/files/IEC-61701_Salt-Corrosion-Test_TUV_April-2014.pdf (accessed 4 Nov 2026). ↩
-
IEC 61701:2020, Photovoltaic (PV) modules: Salt mist corrosion testing, preview. https://cdn.standards.iteh.ai/samples/100114/6e9772c6cda24de095ff4bca0ac6eca7/IEC-61701-2020.pdf (accessed 4 Nov 2026). ↩
-
Dualsun, "What is the salt spray test on Dualsun solar panels?" (IEC 61701 severity 6 cycle definition). https://faq.dualsun.com/en/articles/1750658 (accessed 4 Nov 2026). ↩
-
Oceans of Energy, "North Sea Two". https://oceansofenergy.blue/north-sea-2/ (accessed 4 Nov 2026). ↩
-
TNO, Deltares, DNV and Oceans of Energy, "Structural testing of offshore solar systems and PV modules by wave slamming" (2025). https://publications.tno.nl/publication/34644345/6sL2fzaG/TNO-2025-P10897.pdf (accessed 4 Nov 2026). ↩
-
ESS News, "Incidents similar to Moss Landing battery fire are unlikely but stricter regulations proposed" (28 Jan 2025). https://www.ess-news.com/2025/01/28/incidents-similar-to-moss-landing-battery-fire-are-unlikely-but-stricter-regulations-proposed/ (accessed 4 Nov 2026). ↩
-
BloombergNEF, "Lithium-ion battery pack prices fall to $108 per kilowatt-hour" (9 Dec 2025). https://about.bnef.com/insights/clean-transport/lithium-ion-battery-pack-prices-fall-to-108-per-kilowatt-hour-despite-rising-metal-prices-bloombergnef/ (accessed 4 Nov 2026). ↩
-
Energy-Storage.News, "Battery storage system prices continue to fall sharply, BNEF and Ember reports find" (Dec 2025), reporting BNEF's Energy Storage Systems Cost Survey 2025. https://www.energy-storage.news/battery-storage-system-prices-continue-to-fall-sharply-bnef-and-ember-reports-find/ (accessed 4 Nov 2026). ↩↩
-
Pacific Region Infrastructure Facility, Renewable Energy Costs in the Pacific (2019, 2018 data). https://www.theprif.org/sites/theprif.org/files/documents/prif-renewable-energy-costs.pdf (accessed 4 Nov 2026). ↩↩↩
-
Rolls Battery, S48-100LFP Stack-LV datasheet (more than 6,000 cycles at 80% DoD, 0.5C, 25 °C, 80% EOL). https://www.rollsbattery.com/battery/s48-100lfp-stack-lv/?pdf=26875 (accessed 4 Nov 2026). ↩
-
DNV, "Safe implementation of decarbonization technologies" (Battery(Safety) notation mandatory above 20 kWh). https://www.dnv.com/expert-story/maritime-impact/safe-implementation-of-decarbonization-technologies/ (accessed 4 Nov 2026). ↩
-
Danish Maritime Authority, "Battery operation of ships". https://www.dma.dk/safety-at-sea/ship-safety/batteries-lng-and-oil/battery-operation-of-ships (accessed 4 Nov 2026). ↩
-
CR Classification Society, Guidelines for Lithium-ion Batteries Applied to Marine System/Equipment (Oct 2024). https://www.crclass.org/wp-content/uploads/2024/10/GD-LI-BAT_202410-EN.pdf (accessed 4 Nov 2026). ↩
-
Eriksen, DNV, "Battery propulsion", Interferry conference presentation (2024). https://interferry.com/wp-content/uploads/2024/11/S14.3_Eriksen-DNV.pdf (accessed 4 Nov 2026). ↩
-
Norwegian Maritime Authority, "Supporting preliminary findings after battery incident" (Ytterøyningen). https://www.sdir.no/en/news/supporting-preliminary-findings-after-battery-incident/ (accessed 4 Nov 2026). ↩
-
Shippax, "Preliminary investigation concludes coolant leakage caused the fire onboard the car-ferry YTTERØYNINGEN" (2019). https://www.shippax.com/en/press-releases/preliminary-investigation-concludes-coolant-leakage-caused-the-fire-onboard-the-car-ferry-ytteroyningen.aspx (accessed 4 Nov 2026). ↩
-
Vest brann- og redningsregion, Evalueringsrapport: Brann i MF «Ytterøyningen» 10.10.2019 (in Norwegian). https://vestbrannregion.no/wp-content/uploads/2019/11/Evalueringsrapport-Brann-i-MF-Ytter%C3%B8yningen.pdf (accessed 4 Nov 2026). ↩
-
WECC, Moss Landing BESS Fire Report (22 Dec 2025). https://www.wecc.org/sites/default/files/documents/progress_report/2025/Moss%20Landing%20BESS%20Fire%20Report%20Final%2012.22.25.pdf (accessed 4 Nov 2026). ↩
-
Energy-Storage.News, "BESS failure incident rate dropped 97% between 2018 and 2023" (EPRI, PNNL and TWAICE study, May 2024). https://www.energy-storage.news/battery-storage-failure-incident-rate-dropped-97-between-2018-and-2023/ ; EPRI database: https://storagewiki.epri.com/index.php/BESS_Failure_Event_Database (accessed 4 Nov 2026). ↩
-
Sandia National Laboratories, DOE Energy Storage Handbook, Chapter 7: Flywheels. https://www.sandia.gov/app/uploads/sites/163/2022/03/ESHB_Ch07_Flywheels_Bender.pdf (accessed 4 Nov 2026). ↩
-
Sandia National Laboratories, DOE Energy Storage Handbook, Chapter 11: Hydrogen Energy Storage. https://www.sandia.gov/ess-ssl/wp-content/uploads/2020/12/ESHB_Ch11_Hydrogen_Headley.pdf (accessed 4 Nov 2026). ↩
-
SOLAS Chapter II-1, Regulation 42, "Emergency source of electrical power in passenger ships". https://www.imorules.com/GUID-C048F800-5412-40B3-ACCD-C562D4E4F719.html (accessed 4 Nov 2026). ↩↩
-
Pacific Community (SPC), "Tokelau" country energy profile. https://prdrse4all.spc.int/system/files/tokelau.pdf (accessed 4 Nov 2026). ↩
-
Government of Tokelau, "Solar Project". https://www.tokelau.org.nz/Solar+Project.html (accessed 4 Nov 2026). ↩
-
Solar Power World, "American Samoa's solar+storage microgrid" (Feb 2017). https://www.solarpowerworldonline.com/2017/02/american-samoas-solarstorage-microgrid/ (accessed 4 Nov 2026). ↩
-
Samoa News, "New Satala power plant 90% complete, ASPA reports" (Ta'u backup diesel generators). https://www.samoanews.com/local-news/new-satala-power-plant-90-complete-aspa-reports (accessed 4 Nov 2026). ↩
-
The Cooperative Society, "Islands and renewable energy" (Feb 2024), citing local sources (unverified secondary report). https://thecooperativesociety.org/2024/02/22/islands-and-renewable-energy/ (accessed 4 Nov 2026). ↩
-
Kohler Power, "Advantages of HVO for diesel generators" (white paper). https://resources.kohler.com/power/kohler/industrial/pdf/Advantages_of_HVO_WP.pdf (accessed 4 Nov 2026). ↩
-
Caterpillar, "Renewable liquid fuels for generators: biodiesel and HVO". https://www.cat.com/en_US/by-industry/electric-power/electric-power-industries/renewable-liquid-fuels.html (accessed 4 Nov 2026). ↩
-
Apollo for Net Zero Technology Centre, Alternative Diesel Study (2024; HVO storage stability and flash point). https://www.netzerotc.com/wp-content/uploads/2024/05/apollo-Alternative-diesel-study.pdf (accessed 4 Nov 2026). ↩
-
JRC / ETIP Ocean, Ocean Energy in the EU (2022). https://www.etipocean.eu/wp-content/uploads/2022/11/JRC_Ocean-energy-in-the-EU.pdf (accessed 4 Nov 2026). ↩
-
Offshore Energy, "DMEC models forecast tidal and wave energy growth in Europe" (2024). https://www.offshore-energy.biz/dmec-models-forecast-tidal-and-wave-energy-growth-in-europe/ (accessed 4 Nov 2026). ↩
-
ETIP Ocean, Strategic Research and Innovation Agenda for Ocean Energy (2024). https://www.etipocean.eu/wp-content/uploads/2024/10/ETIP-Ocean-2024-SRIA.pdf (accessed 4 Nov 2026). ↩
-
Vega and Martin, "Ocean Thermal Energy Conversion (OTEC) economics: updates and strategies" (2024), via PNNL Tethys Engineering. https://tethys-engineering.pnnl.gov/sites/default/files/publications/Vega-Martin-2024.pdf (accessed 4 Nov 2026). ↩
-
Makai Ocean Engineering, "Ocean Thermal Energy (OTEC)". https://www.makai.com/renewable-energy/otec/ (accessed 4 Nov 2026). ↩
-
Howard et al., Domestic Water Quantity, Service Level and Health, 2nd ed., WHO (2020). https://www.who.int/publications/i/item/9789240015241 (accessed 4 Nov 2026). ↩
-
PUB Singapore, "From every drop to every moment" (Mar 2025; 142 L/person/day in 2024). https://www.pub.gov.sg/Resources/News-Room/PressReleases/2025/03/From-Every-Drop-to-Every-Moment (accessed 4 Nov 2026). ↩
-
Barbosa et al., "Comparison of land, water, and energy requirements of lettuce grown using hydroponic vs. conventional agricultural methods", IJERPH 12(6), 2015. https://www.mdpi.com/1660-4601/12/6/6879 (accessed 4 Nov 2026). ↩↩↩
-
"Energy recovery in SWRO desalination: current status and new possibilities", Frontiers in Sustainable Cities (2020). https://www.frontiersin.org/journals/sustainable-cities/articles/10.3389/frsc.2020.00009/full (accessed 4 Nov 2026). ↩
-
"Energy consumption of reverse osmosis seawater desalination: possibilities for its optimisation in design and operation of SWRO plants", Desalination and Water Treatment 13 (2010). https://www.deswater.com/DWT_articles/TDWT_I_13_01-03_tfja/TDWT_A_10513365/TDWT_A_10513365_O.pdf (accessed 4 Nov 2026). ↩
-
WHO, Safe Drinking-water from Desalination, WHO/HSE/WSH/11.03 (2011). https://iris.who.int/bitstream/handle/10665/70621/WHO_HSE_WSH_11.03_eng.pdf (accessed 4 Nov 2026). ↩
-
GlobalUF, "Seawater desalination plant cost: CAPEX and OPEX" (2026 quotation data). https://www.globaluf.com/seawater-desalination-plant-cost/ (accessed 4 Nov 2026). ↩↩
-
Besta Membrane, "Seawater desalination costs and ROI: 2025 insights" (supplier guide). https://bestamembrane.com/seawater-desalination-costs-roi-2025-insights/ (accessed 4 Nov 2026). ↩↩
-
Instituto de Meteorología e Hidrología de Panamá, Caracterización del clima en el distrito de Panamá (annual mean 1,917.3 mm). https://www.imhpa.gob.pa/uploads/documentos/caracterizacin_del_clima_en_el_distrito_de_panam.pdf (accessed 4 Nov 2026). ↩
-
Deutscher Wetterdienst, Klimatafel von Tarawa, Bonriki (1951 to 1990 normals). https://dwd.de/DWD/klima/beratung/ak/ak_916100_kt.pdf (accessed 4 Nov 2026). ↩
-
Pacific-Australia Climate Change Science and Adaptation Planning Program, Current and future climate of Kiribati. https://www.pacificclimatechange.net/sites/default/files/11_PACCSAP-Kiribati-11pp_WEB.pdf (accessed 4 Nov 2026). ↩
-
Jones et al., "The state of desalination and brine production: a global outlook", Science of the Total Environment 657 (2019). https://www.sciencedirect.com/science/article/abs/pii/S0048969718349167 (accessed 4 Nov 2026). ↩
-
California State Water Resources Control Board, Management of Brine Discharges to Coastal Waters: Recommendations of a Science Advisory Panel (2012). https://waterboards.ca.gov/water_issues/programs/ocean/desalination/docs/dpr.pdf (accessed 4 Nov 2026). ↩
-
"Impacts of desalination brine discharge on benthic ecosystems", Environmental Science & Technology (2024). https://doi.org/10.1021/acs.est.3c07748 (accessed 4 Nov 2026). ↩
-
IMO, Resolution MEPC.227(64), 2012 Guidelines on Implementation of Effluent Standards and Performance Tests for Sewage Treatment Plants. https://wwwcdn.imo.org/localresources/en/KnowledgeCentre/IndexofIMOResolutions/MEPCDocuments/MEPC.227%2864%29.pdf (accessed 4 Nov 2026). ↩
-
HydropureWater, "Food processing wastewater treatment in the Netherlands: 2026" (packaged MBR energy and cost table; supplier). https://hydropurewater.com/blog/6369-food-processing-wastewater-treatment-in-the-netherlands-2026-eu-compliance.html (accessed 4 Nov 2026). ↩
-
HydropureWater, "MBR cost: 2026 CAPEX vs OPEX breakdown guide" (supplier). https://hydropurewater.com/blog/193-mbr-wastewater-treatment-system-cost-2025-capex-vs-opex-breakdown.html (accessed 4 Nov 2026). ↩↩
-
The MBR Site, "MBRs: the Chinese experience". https://www.thembrsite.com/features/mbrs-the-chinese-experience (accessed 4 Nov 2026). ↩
-
World Bank, What a Waste 3.0 (2.56 billion tonnes in 2022; per-capita figure derived by this author). https://datatopics.worldbank.org/what-a-waste/trends_in_solid_waste_management.html (accessed 4 Nov 2026). ↩
-
FAO/WHO/UNU, Human Energy Requirements, Report of a Joint Expert Consultation (2004). https://www.fao.org/4/y5686e/y5686e00.htm (accessed 4 Nov 2026). ↩
-
"Evaluation of tropical tomato for growth, yield, nutrient, and water use efficiency in recirculating hydroponic system", Agriculture 10(7), 2020. https://www.mdpi.com/2077-0472/10/7/252 (accessed 4 Nov 2026). ↩
-
HortiDaily, "Strengthening Paraguay's commitment to precision hydroponic production" (35 kg/m²/yr tomatoes). https://www.hortidaily.com/article/9758398/strengthening-paraguay-s-commitment-to-precision-hydroponic-production/ (accessed 4 Nov 2026). ↩
-
USDA FoodData Central, "Tomatoes, red, ripe, raw, year round average", FDC ID 170457 (18 kcal/100 g), as reproduced by NutriDB. https://nutri-db.com/en/foods/170457 (accessed 4 Nov 2026). ↩
-
FAO, "Approximate nutrient levels of various staples" (calories per hectare per season, 1985 workshop data). https://www.fao.org/4/X5415E/x5415e06.htm (accessed 4 Nov 2026). ↩
-
WHO, "Healthy diet" fact sheet. https://www.who.int/news-room/fact-sheets/detail/healthy-diet (accessed 4 Nov 2026). ↩
-
FAO, "The production and use of Eucheuma" (15 to 30 dry t/ha/yr). https://www.fao.org/4/x5819e/x5819e06.htm (accessed 4 Nov 2026). ↩
-
FAO, Seaweeds and Microalgae: An Overview for Unlocking their Potential in Global Aquaculture Development (2021). https://openknowledge.fao.org/server/api/core/bitstreams/43da43ad-be75-4aaa-ba4a-e375b1c65cfc/content (accessed 4 Nov 2026). ↩
-
"Environmental impacts of seaweed farming in the tropics" (review, hosted by UNAM). https://biomar.fciencias.unam.mx/Sobretiros/Informacion%20algas/Algas/General/seaweed%20farming%20impacts%20in%20tropic.pdf (accessed 4 Nov 2026). ↩
-
Starlink, "Starlink Business: Maritime" (Global Priority plans and Flat High Performance hardware price). https://starlink.com/as/business/maritime (accessed 4 Nov 2026). ↩↩
-
Starlink, Flat High Performance Kit Specifications. https://starlink.com/public-files/specification_sheet_flat_high_performance.pdf (accessed 4 Nov 2026). ↩↩
-
Starlink Insider, "Starlink Maritime: plans, prices and boat hardware (2026)". https://starlinkinsider.com/starlink-maritime/ (accessed 4 Nov 2026). ↩
-
ISPreview, "Starlink tweak Personal Maritime broadband plan to support bigger boats" (Sep 2026). https://www.ispreview.co.uk/index.php/2026/09/starlink-tweak-personal-maritime-broadband-plan-to-support-bigger-boats.html (accessed 4 Nov 2026). ↩
-
SATMARIN, "Eutelsat OneWeb maritime plans and pricing". https://satmarin.com/airtime/oneweb/ (accessed 4 Nov 2026). ↩↩
-
AST Networks, "OneWeb TBYB terms and conditions, maritime" (Intellian OW50M MSRP). https://ast-networks.com/wp-content/uploads/2024/12/OneWeb-TBYB-Terms-and-Conditions.pdf (accessed 4 Nov 2026). ↩↩
-
Amazon, "Amazon's satellite internet comes to maritime customers through strategic agreements" (10 Feb 2026). https://press.aboutamazon.com/amazon-leo/2026/2/amazons-satellite-internet-comes-to-maritime-customers-through-strategic-agreements (accessed 4 Nov 2026). ↩
-
Satlink, "Satlink announces agreement as authorized reseller of Amazon Leo" (20 Oct 2026). https://satlink.es/en/media/news/satlink-authorized-reseller-amazon-leo-maritime (accessed 4 Nov 2026). ↩
-
SOLAS Chapter IV, Radiocommunications (2024 consolidated). https://www.imorules.com/solas/05_chapter_IV.html (accessed 4 Nov 2026). ↩
-
Lloyd's Register, Class News 25/2023, "SOLAS GMDSS requirements". https://www.lr.org/en/knowledge/class-news/25-23/ (accessed 4 Nov 2026). ↩↩
-
Candela, "P-12 Shuttle electric ferry" (specifications). https://candela.com/pro-series/p-12-shuttle/ (accessed 4 Nov 2026). ↩
-
Charged Marine, "Candela P-12 Shuttle electric ferry" (wave-handling specification). https://www.chargedmarine.com/products/candela-p-12-shuttle-electric-ferry (accessed 4 Nov 2026). ↩
-
Candela press release, "World's first electric flying passenger ship takes off, enters production" (€2.5m Shuttle). https://www.mynewsdesk.com/candela-speedboat-ab/pressreleases/worlds-first-electric-flying-passenger-ship-takes-off-enters-production-3286832 (accessed 4 Nov 2026). ↩↩
-
electrive.com, "Candela kicks off series production of the P-12 water taxi" (17 Nov 2023; €1.7m). https://www.electrive.com/2023/11/17/candela-kicks-off-series-production-of-the-p-12-water-taxi/ (accessed 4 Nov 2026). ↩↩
-
Leonardo Helicopters, "AW139" technical data. https://helicopters.leonardo.com/en/products/aw139 (accessed 4 Nov 2026). ↩
-
UK Civil Aviation Authority, CAP 437: Standards for Offshore Helicopter Landing Areas, 9th ed. Amdt 1. https://www.caa.co.uk/media/3ccjonps/cap437-standards-for-offshore-helicopter-landing-areas-edition-9-amendm-1.pdf (accessed 4 Nov 2026). ↩
-
IMO, Resolution A.800(19), Revised Guidelines for Approval of Sprinkler Systems Equivalent to that Referred to in SOLAS Regulation II-2/12. https://wwwcdn.imo.org/localresources/en/KnowledgeCentre/IndexofIMOResolutions/AssemblyDocuments/A.800(19).pdf (accessed 4 Nov 2026). ↩
-
UK Maritime and Coastguard Agency, MSIS 12, Chapter 4 (equivalent sprinkler and water-mist systems). https://assets.publishing.service.gov.uk/media/5a7cc5eee5274a38e5756a8c/msis_12_-_ch4_rev_0313.pdf (accessed 4 Nov 2026). ↩
-
US Coast Guard Marine Safety Center, "Guidelines for watermist fire suppression systems", PRG E1-03. https://www.dco.uscg.mil/Portals/9/MSC/PRG/PRG.E1-03.2017.02.16.Watermist_Fire_Suppression_Systems.pdf (accessed 4 Nov 2026). ↩
-
Peterson, "A global LIS/OTD climatology of lightning flash extent density", JGR Atmospheres (2021). https://agupubs.onlinelibrary.wiley.com/doi/10.1029/2020JD033885 (accessed 4 Nov 2026). ↩
-
NASA Earth Observatory, "Global lightning activity". https://science.nasa.gov/earth/earth-observatory/global-lightning-activity-85600/ (accessed 4 Nov 2026). ↩
-
IRENA, Renewable Power Generation Costs in 2024 (2025). https://www.irena.org/Digital-Report/Renewable-Power-Generation-Costs-in-2024 (accessed 4 Nov 2026). ↩
-
US DOE, "Solar photovoltaic system cost benchmarks" (Q1 2025, 2024 USD). https://www.energy.gov/cmei/systems/solar-photovoltaic-system-cost-benchmarks (accessed 4 Nov 2026). ↩↩
-
US EIA, "Construction cost data for electric generators" (2024 installations). https://www.eia.gov/electricity/generatorcosts/ (accessed 4 Nov 2026). ↩
-
NREL, A Comparison of Fuel Choice for Backup Generators (2019). https://doi.org/10.2172/1505554 (accessed 4 Nov 2026). ↩
-
Open Factory, "Generator set: what public buyers paid" (bid tabulations to Aug 2026). https://open-factory.com/prices/diesel-genset/ (accessed 4 Nov 2026). ↩
-
Top Greenhouse Tech, "How much does a commercial greenhouse cost in Southeast Asia?" (supplier guide). https://www.topgreenhousetech.com/commercial-greenhouse-cost-in-southeast-asia.html (accessed 4 Nov 2026). ↩